Don’t Let Subvisible Particles Threaten Your Drug’s Efficacy
Subvisible particles, measuring roughly 10 µm in size, can cause a range of serious health issues, from clogging capillaries to sparking life-threatening immune reactions. In response to the alarming effects these particles pose, the FDA has set strict standards for injectable drug products: they must be virtually free of them.
Manufacturers need powerful technology solutions capable of fully characterizing subvisible particles throughout the development cycle to ensure therapies are safe and effective prior to patient use.
Yet legacy particle analysis methods fail to provide adequate protection, leaving invisible particles unchecked and patient safety in danger.
What if there was a more efficient solution?
Develop Faster, Smarter, Safer When You Rethink Particle Analysis
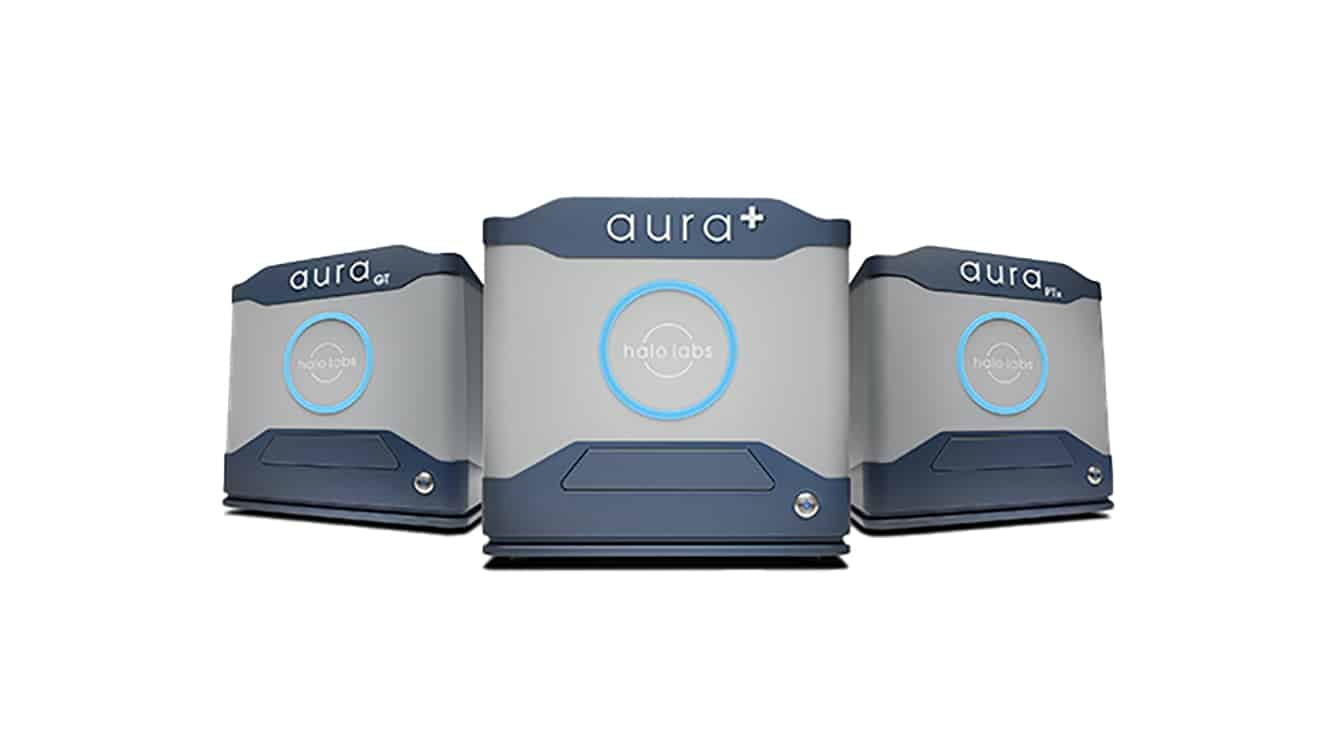
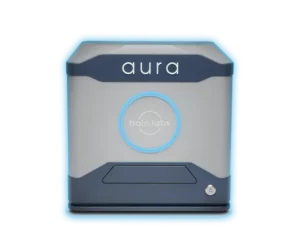
With Halo Labs cutting-edge Aura systems, subvisible particle analysis is possible at the very beginning of your process. This is a big step forward that can speed up development and help you make better, clearer decisions, preventing problems before they become expensive bottlenecks.
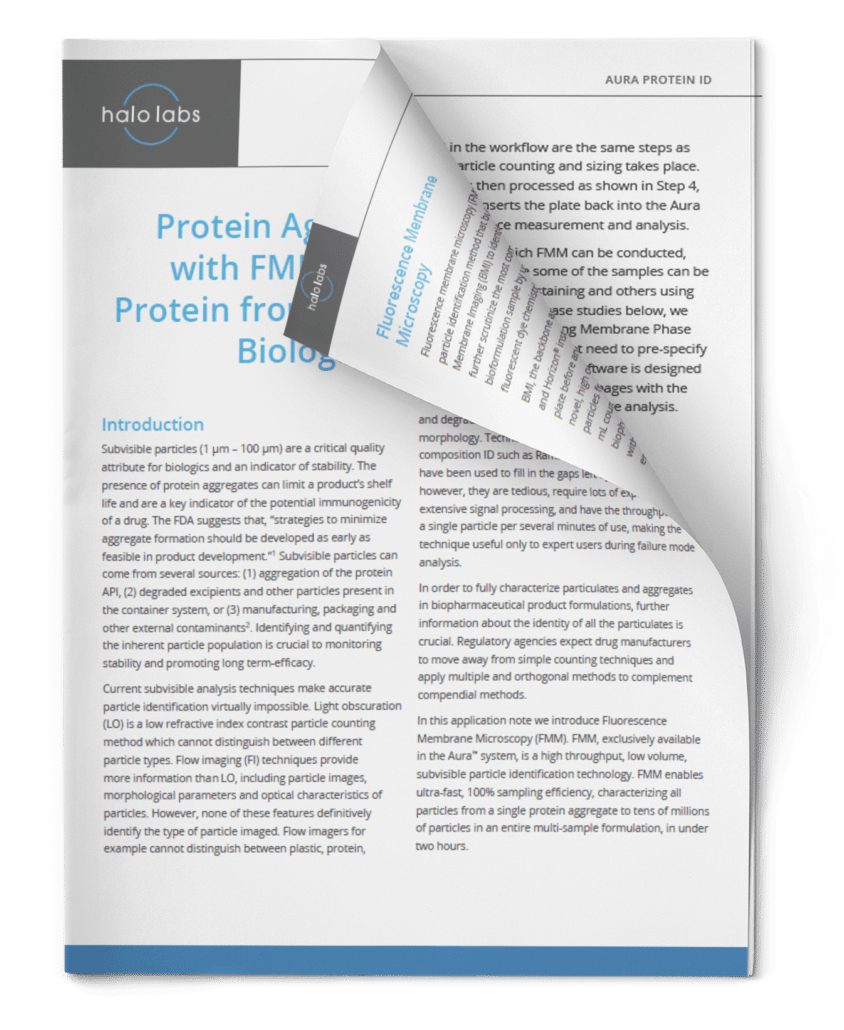
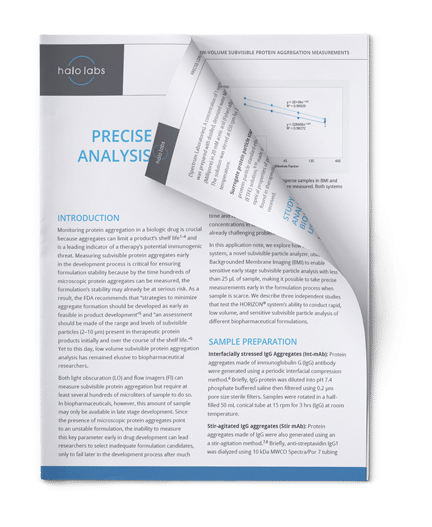
Using Backgrounded Membrane Imaging (BMI) and Fluorescence Membrane Microscopy (FMM) technologies, Aura uncovers crucial subvisible particle data, which leads to more accurate results and better insight.
Why Use Aura for Particle Analysis?
- Detect and characterize particles not measured by dynamic light scattering (DLS) or size exclusion chromatography (SEC)
- Preserve sample, using as little as 5 μL per test
- Screen a wide range of conditions with our 96-well format
- Obtain detailed information on particles that other methods can’t deliver, including size, morphology, count, and distribution
- Move quickly with an analysis time of about 1 minute per sample
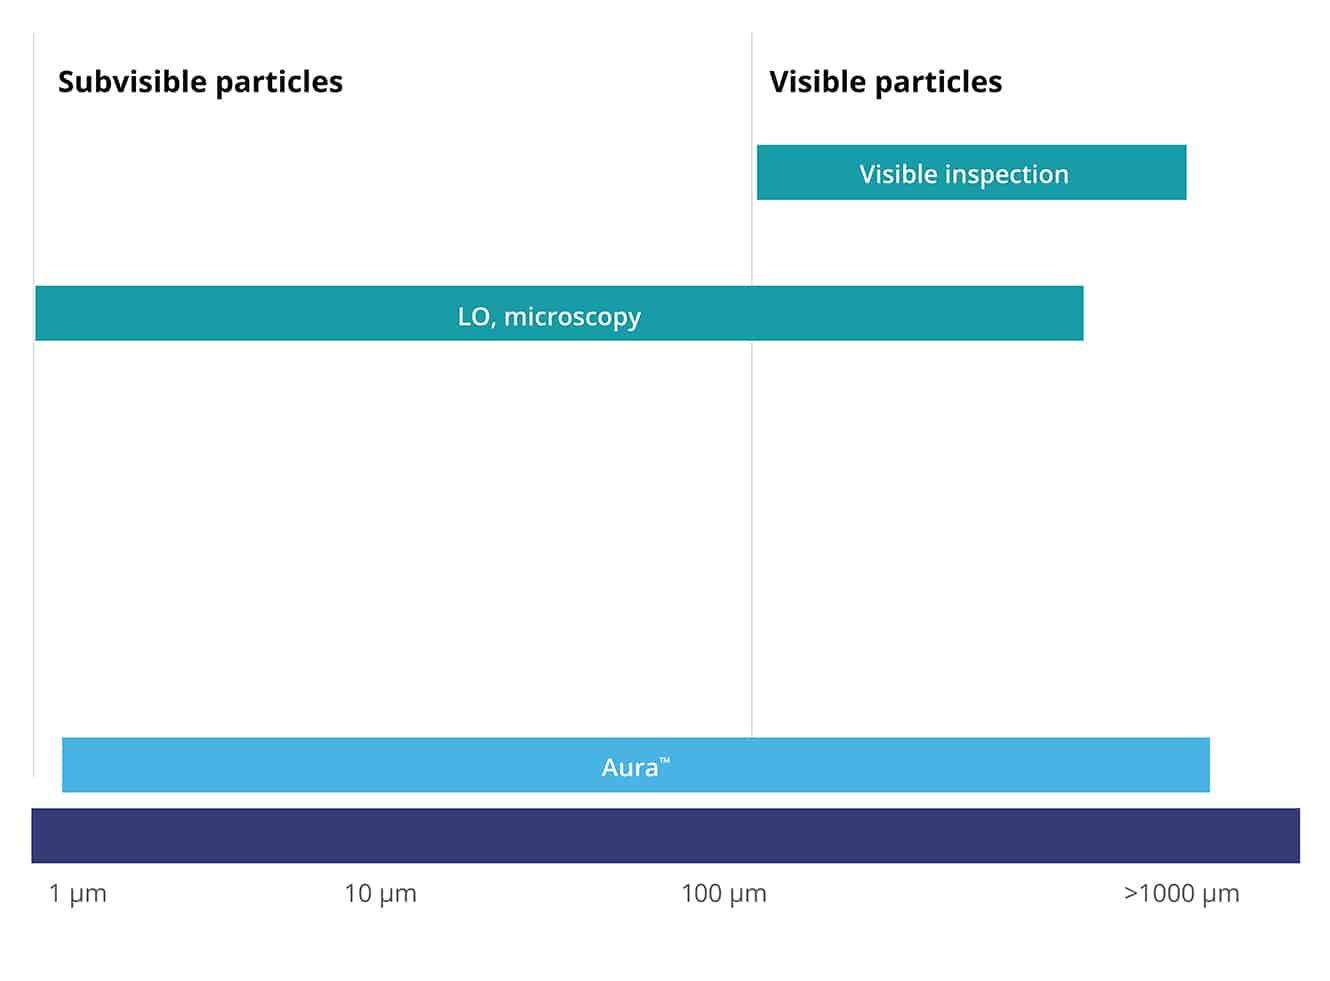
- Evaluate a wide range of particle sizes, measuring 1 μm to 5 mm with high reproducibility
- Achieve high sensitivity because particles are imaged without the interference of buffer or matrix
- See more detail for better particle identification with high-resolution magnification
- Maintain compliance with the option for 21 CFR Part 11 software
Small Volumes, Fast Answers
With Aura, you only need a small volume of material to get answers quickly, so you don’t waste time or money on products that won’t make it through development.
When you can assess visible and subvisible particles using microliter volumes at high throughput AND identify particles through fluorescence methods, you get a powerful screening tool that speeds up development from pre-IND into clinical phases.
USP 788 Compliant Data
Subvisible particle analysis is of the utmost importance, as it allows us to accurately characterize large visible contaminants and ensure patient safety. USP 788 governs this process, and all its requirements must be met.
The Aura platform, powered by BMI, provides a USP 788 compendial method that is rapid and robust. Unlike other subvisible particle analysis methods, the Aura can handle a broad range of sample types and volumes, enabling continuity of method from candidate selection to lot release.
Featured products
Frequently Asked Questions
Ultrafine particles and nanoparticles are both types of particles with dimensions on the nanometer scale, but they differ in their sources, properties, and applications. Ultrafine particles refer to particles with sizes typically ranging from 1 to 100 nanometers, generated from natural or anthropogenic sources such as combustion processes, industrial emissions, or atmospheric aerosols. Nanoparticles, on the other hand, encompass a broader range of particle sizes up to 1000 nanometers and can be engineered or synthesized for various applications, including drug delivery, imaging, diagnostics, and materials science. While both ultrafine particles and nanoparticles exhibit unique physicochemical properties due to their small size, nanoparticles are designed and manipulated to achieve specific functionalities or behaviors, whereas ultrafine particles may arise as byproducts of natural or human activities.
Subvisible particles, which include particles larger than 1 micron in size, can be measured using various analytical techniques to assess the quality and safety of pharmaceutical products. Common methods for measuring subvisible particles include:
- Light obscuration (LO): LO methods use a light source and photodetector to measure the decrease in light intensity caused by particles passing through a small detection zone, allowing quantification of particle concentration and size distribution in liquid formulations.
- Microscopy particle counting: Microscopic techniques such as optical microscopy or phase-contrast microscopy visually inspect liquid samples under a microscope to manually count and size particles, providing qualitative and quantitative data on particle characteristics. Aura systems are automated optical microscopy platforms designed specifically for the analysis and measurement of subvisible particles.
- Flow imaging microscopy (FIM): FIM systems capture images of particles in liquid samples flowing through a microfluidic channel, allowing automated counting, sizing, and characterization of particles based on their morphology, size, and optical properties.
- Laser diffraction: Laser diffraction methods analyze the scattering patterns of laser light passing through a liquid sample containing particles, providing information on particle size distribution and concentration.
- Fluorescence Membrane Microscopy (FMM): A key component of the Aura+ and Aura PTx systems, FMM uses specific fluorescent dyes ot conjugated antibodies to detect and quantitate subvisible particles.
These methods enable the detection, quantification, and characterization of subvisible particles in pharmaceutical formulations, ensuring compliance with regulatory standards and product specifications.
Particle size determination involves measuring the dimensions of particles in a sample, which can vary from nanometers to micrometers depending on the application and analytical technique. Common methods of determining particle size include:
- Laser diffraction: Laser diffraction techniques analyze the scattering patterns of laser light passing through a sample containing particles, providing information on particle size distribution based on the diffraction pattern.
- Dynamic light scattering (DLS): DLS measures the fluctuations in scattered light intensity caused by the Brownian motion of particles in a suspension, yielding particle size distribution information based on the intensity autocorrelation function.
- Nanoparticle tracking analysis (NTA): NTA systems visualize and track individual nanoparticles in suspension using light microscopy and particle tracking algorithms, providing real-time size distribution and concentration data.
- Electron microscopy: Electron microscopy techniques such as transmission electron microscopy (TEM) and scanning electron microscopy (SEM) provide high-resolution images of individual particles, allowing direct visualization and measurement of particle size and morphology.
- Coulter counter: Coulter counters use the principle of electrical impedance to detect and count particles as they pass through a small aperture, providing information on particle size distribution based on the changes in electrical resistance.
- Sieving: Sieving methods involve passing a sample through a series of sieves with progressively smaller mesh sizes, separating particles based on size and providing information on particle size distribution by weight or volume.
- Light Microscopy: this traditional technique can directly count and characterize subvisible particles in the size range of 0.8–150 µm, as described in both USP 788 and Ph.Eur.2.9.19. Still, manual light microscopy is low-throughput and produces less accurate results than the light obscuration technique. Aura systems are automated optical microscopy platforms.
These methods offer complementary approaches to characterizing particle size, allowing researchers to select the most suitable technique based on sample properties, size range, and measurement requirements. For more information on the different types of particle size analyzers, check out our blog post.
Quantitative methods for determining particle size distribution involve measuring the frequency or proportion of particles within specific size ranges in a sample. Common quantitative methods include:
- Laser diffraction: Laser diffraction techniques analyze the scattering patterns of laser light passing through a sample containing particles, providing information on particle size distribution based on the intensity of scattered light at different angles.
- Dynamic light scattering (DLS): DLS measures the fluctuations in scattered light intensity caused by the Brownian motion of particles in a suspension, yielding particle size distribution information based on the autocorrelation function of intensity fluctuations.
- Nanoparticle tracking analysis (NTA): NTA systems visualize and track individual nanoparticles in suspension using light microscopy and particle tracking algorithms, providing real-time size distribution and concentration data.
- Sedimentation methods: Sedimentation techniques such as analytical ultracentrifugation (AUC) or centrifugal sedimentation measure the sedimentation rate of particles in a liquid medium, yielding information on particle size distribution based on the sedimentation coefficient or size distribution coefficient.
- Microscopy image analysis: Microscopic techniques such as optical microscopy or electron microscopy combined with image analysis software quantify the number and size of particles in captured images, providing particle size distribution data based on image processing such as Aura systems with Particle Vue software.
These quantitative methods offer precise and reliable approaches to characterizing particle size distribution, enabling researchers to assess the uniformity, stability, and performance of particulate samples in various applications


