Understanding your product’s particle size distribution can help you predict its manufacturability, efficacy, quality, bioavailability, and shelf life. Larger particles can decrease porosity, limiting the passage of the drug and potentially blocking it from reaching its target site. Conversely, very small particles can add to the surface area of a drug, which can lead to unintended side effects. In short, the wrong particle sizes can interfere with production, yields, and profits.
Nearly all biotherapeutics contain subvisible particles (between 2 and 100 µm in diameter), varying in volume and shape. The most important property of particulate samples is particle size, which can be crucial to the success of your final product.
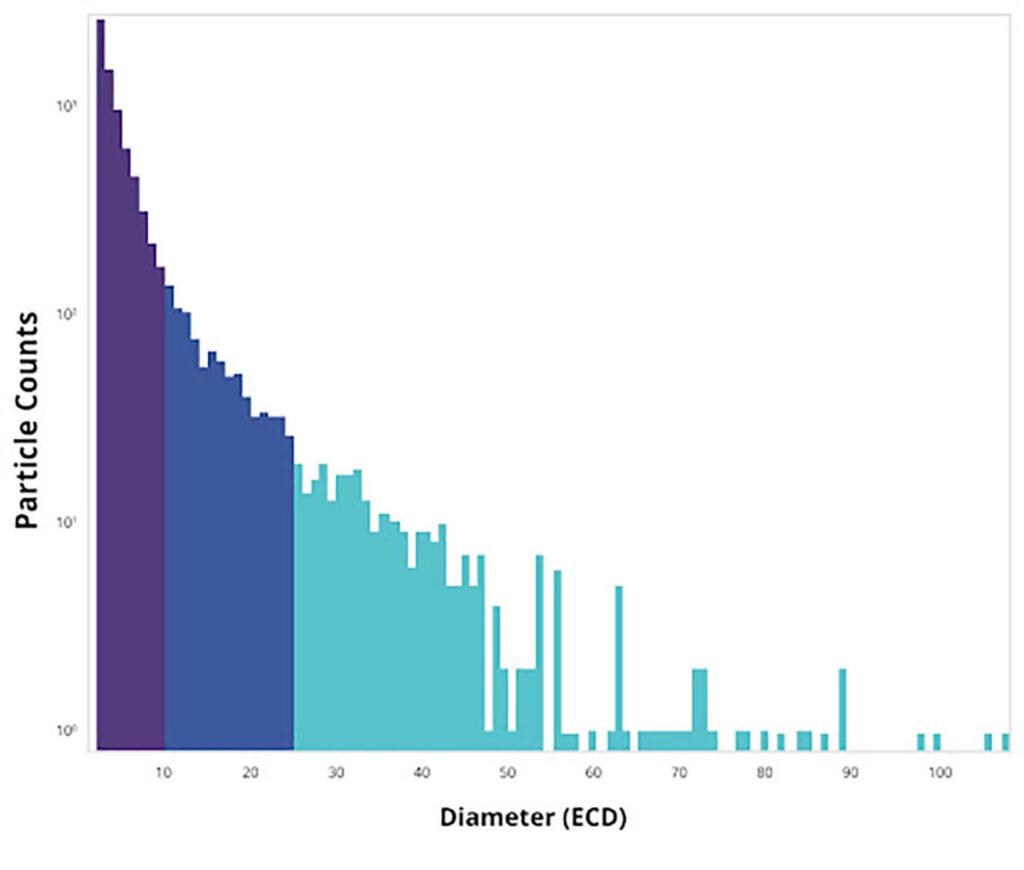
Particle size distribution analysis is a statistical diagram of particles of different sizes. It measures the number and variation of particle size in a drug. This distribution is usually displayed as a frequency distribution curve.
Most particle diameter analysis forms a bell curve—in this case, the x-axis represents the particle size, and the y-axis represents the frequency of a given-sized particle. Usually, a range of statistical parameters is calculated. These parameters can include:
- Mean—the “average” size of a population
- Median—the “middle” size, in which half the population is below and the other half above that size
- Mode—size that occurs the most
Each bell curve will probably be shaped differently, and that shape helps characterize the particles in your product. The placement of mean, median, and mode helps determine that shape. Pharmaceutical manufacturers also use D-values to calculate a size distribution curve:
- D50—median particle size
- D10—10 percent of particles are smaller than this number
- D90—90 percent of particles are smaller than this number
Narrower distribution curves will have these three D-values grouped more closely. A tight distribution curve is optimal because, under that curve, particle sizes are more alike.
Techniques for particle size analysis
There are several particle size analytical methods available. The proper technique will depend on the types of particles analyzed and their size. Methods include:
Sieving
One of the oldest methods of sorting particles by size. Test sieves consist of a woven-wire mesh that creates pores of the desired size. Mechanical sieving works best when the majority of particles are larger than 75 µm, and is most useful for coarser grades of powder or granule.
Sedimentation
This measures the time taken for particles to travel through a viscous liquid. Smaller particles take longer to travel than larger ones, and this technique is useful for sizes below 10 µm. This technique cannot measure sub-micrometer particles.
Laser diffraction
Also known as static laser light scattering, this method measures size indirectly by detecting intensity distributions of laser light scattered by particles. Shape evaluation is not possible (it assumes all particles are spherical), and low resolution and sensitivity are disadvantages. It is not as effective in polydisperse samples.
Dynamic light scattering (DLS)
In this method, particles move past a camera and are analyzed in real time. Millions of particles can be examined in minutes with this method. DLS can report a variety of size as well as shape parameters. Currently, DLS is the most commonly used method for biotherapeutic particle size distribution analysis.
Imaging (microscopy, SEM)
Here, particles are measured by comparing their size against a grid of lines and counting them. However, millions of particles need to be measured to achieve a statistically valid analysis. Automated analysis of electron micrographs helps ease this barrier. This method is useful for particle sizes within 0.2 to 100 µm.
BMI/FMM
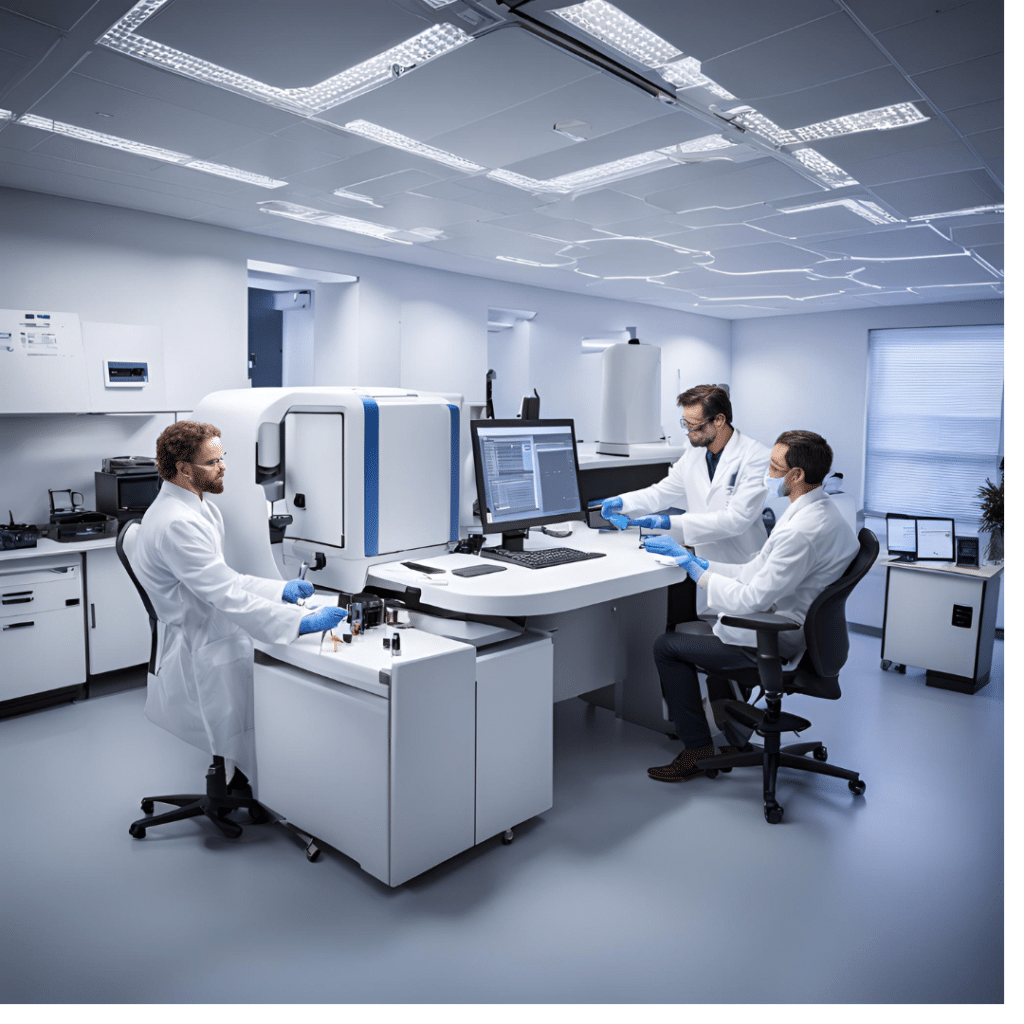
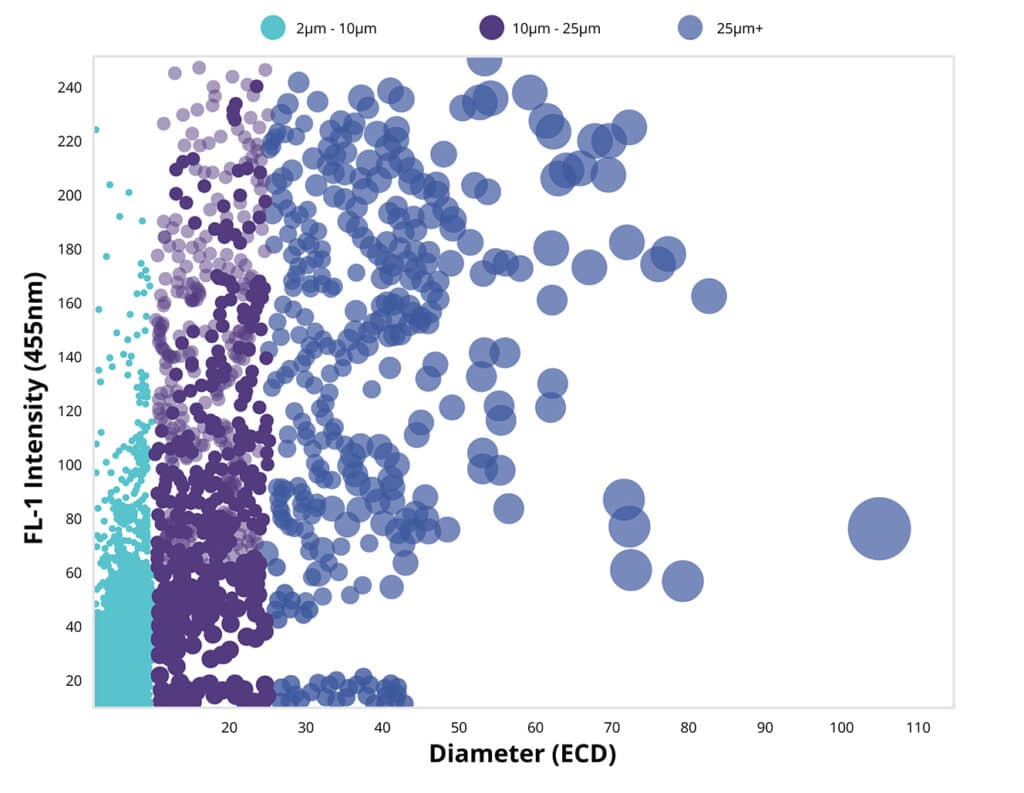
Backgrounded membrane imaging (BMI), combined with fluorescence membrane microscopy, are the basis of Halo Labs’ Aura® particle analysis system. BMI, a high-contrast imaging technique, develops clear pictures of particles in a sample. It only requires 5 µl of sample and can deliver results in a minute. Fluorescence Membrane Imaging (FMM) labels particles using specific fluorescent dyes or immunoassays, resulting in simple and definitive identification.
Equipment for particle size measurement
Particle size measurement equipment can vary in complexity, from a simple mesh sieve and sedimentation to more automated scanning electron microscopy and Aura’s BMI/FMM analysis technology. Particle size analyzers using optics or laser diffraction can provide information on a wide range of particle sizes, while the Aura system can determine the number and type of particles in your sample. Other methods, such as Coulter counters, measure temporary changes in liquid conductivity.
Measurement accuracy will vary among these techniques and instruments. In general, the more sophisticated the technology and automated the process, the more accurate measurements will be generated. If looking at larger, homogeneous particles, a sieve or sediment analysis may be all that’s necessary. However, most biotherapeutic formulations have complex particle size distributions that need more sophisticated methods to arrive at actionable results.
Choosing the right particle size distribution analysis equipment is largely dependent on what particle size you want to measure, accurately. FDA and USP <788> demand a virtual elimination of subvisible particles (below 100 µm), so most biotherapeutic/pharmaceutical analyses will need to include that size range. Dynamic image analysis can detect down to 0.8 µm, while laser diffraction can detect particles down to 10 nm, and dynamic light scattering down to 0.3 nm; due to particle size limitations of these methods, they are not well suited for subvisible and visible particle analysis.The Halo Labs Aura system can detect visible and subvisible particles, down to 1 µm.
For pharmaceutical manufacturing, arriving at the correct particle size distribution via the right analysis ensures product consistency and quality. An incorrect particle size distribution may prevent the active pharmaceutical ingredient from reaching the right part of the body at the right concentration. Particles that are too large can impact inhaled drugs, too—if too large, they remain stuck in the throat. If too small, the patient will probably exhale them before they can reach the right part of the lungs. Smaller particle sizes can also eliminate the need to eat food while taking an oral drug. Smaller particles are less likely to irritate the gastrointestinal tract.
Particle size distribution is also important for determining how well a drug is manufactured. Small particles often impede flow (how particles move with each other and in connection with their container). Size also dictates how well a tablet holds together, which determines the shelf life of a product.
Software and standards for particle size distribution
Having the right particle size analysis software is key to making research simpler, faster and more efficient. Tools like the Halo Labs Particle Vue Automated Particle Analysis Software combine analytics and algorithms with multidimensional visualization, detecting and analyzing particles in a variety of samples. With advanced algorithms, particle size analytics and image navigation, you can see images and data in one simple view. It will also let you dive deeper into your sample analysis with advanced data management and visualizations. A good software package will let you analyze subpopulations of particles, helping make smarter decisions.
International standards and regulations for particle size distribution are set by the US Pharmacopeia (USP), particularly USP <788>, and the US Food and Drug Administration (FDA). USP standards for injectable therapies maintain that the average number of particles in tested samples does not exceed 12 per ml equal to or greater than 10 µm and does not exceed 2 per mL equal to or greater than 25 µm.
According to the US FDA, particle size distribution should be measured at release (at least). Most particles should be under 5 µm, “only a minimum number should be over 10 µm,” FDA guidance states. Previously, FDA guidelines had been ambiguous, but no longer. Recent FDA warning letters to pharmaceutical firms have advised that certain product containers, at least, be free of particles.
Particle size distribution analysis challenges and solutions
Challenges to particle size distribution analysis lie in two main areas: regulatory/USP requirements and the complex nature of biotherapeutic formulations. However, it is important to produce a drug that can be sold at a premium, have minimal rejection rates or lot losses, and show compliance with regulations and standards.
Higher resolution is key to compliance since the FDA and USP <788> require virtual elimination of subvisible particles in a sample. This means that instruments and analysis must be able to both detect and measure particles down to at least 5 µm. Not all techniques can achieve this. Shape of a particle is also important to characterize, since assuming all particles are spherical (or at least the same shape) introduces the probability of increased error and decreased accuracy. Determining particle shape is only possible by introducing microscopy- or light-diffusion methods.
The Halo Labs Aura measuring and analysis tools can uncover subvisible particle data, leading to more accurate results, better decision-making and improved regulatory/standardization compliance. Backgrounded Membrane Imaging (BMI) provides clearer images of particles than ever before, and provides that data quickly. Fluorescence Membrane Microscopy (FMM) uses specific dyes or fluorescently labeled antibodies to identify specific aggregates. In addition, Side Illumination Membrane Imaging (SIMI), a part of every BMI measurement, characterizes extrinsic or inorganic particles in your sample. Moreover, quality control and assurance is improved because you can conduct these tests with very little sample (5 µl) and start testing much earlier in the discovery and development stages of your proposed biotherapeutic.
Future Trends and Innovations
The move toward complex biotherapeutics—cell therapy, gene therapy, therapeutic proteins, and vaccines—is accelerating. These new drugs are often more efficacious and targeted, with the potential to treat diseases that previously had no cure, with fewer side effects.
This promise can only be upheld with superior product quality. Particle size analysis plays an enormous role in this promise, by reducing the health and quality risks posed by too many particles, and particles of the wrong size. Innovations in imaging and particle detection and counting, such as the Halo Labs Aura family, will improve resolution, making products better and detecting particle issues at earlier stages of development. New innovations like machine learning will also improve analytical tools and software, allowing for better, more precise decisions, faster.
More accurate particle size distribution analysis is key to quality and safety
Particle size distribution has become an important measure of biotherapeutic product quality and safety, as more manufacturers move toward the adoption of cell, gene, and protein drugs and vaccines. Since particles are much more prevalent in these formulations, regulators and manufacturers alike have looked toward more accurate analysis as the key to approving and creating these therapies. Particle size distribution:
- Take statistical measurements (mean, median and mode) to determine the makeup of a sample. These distributions make up the USP and FDA standards and regulations on approving a new product.
- Many technologies can produce particle size distribution curves, but relatively few can accurately detect subvisible particles which present the highest risks to product quality and rejection.
- Newer methods like Aura analyzers can image and characterize smaller particles, providing a more complete picture of particle distribution in your samples.
If you would like to continue the conversation on particle size distribution and the Aura family of analytical instruments, please contact us.
REFERENCE LINKS
https://www.sciencedirect.com/science/article/pii/S0168365919301130
DISCOVER THE AURA FAMILY


Read More ON this topic
")


